What is the carbon footprint?
The carbon footprint refers to the total amount of greenhouse gases (GHGs), such as carbon dioxide (co2), methane (ch4), and nitrous oxide (n2o), emitted by human activities. It can be measured at the individual, company, or country level. An individual’s carbon footprint includes emissions from energy consumption, transportation, and food. Companies’ footprints include production and logistics, while national footprints focus on a country’s overall emissions. Reducing this footprint helps limit global warming and achieve global climate goals.
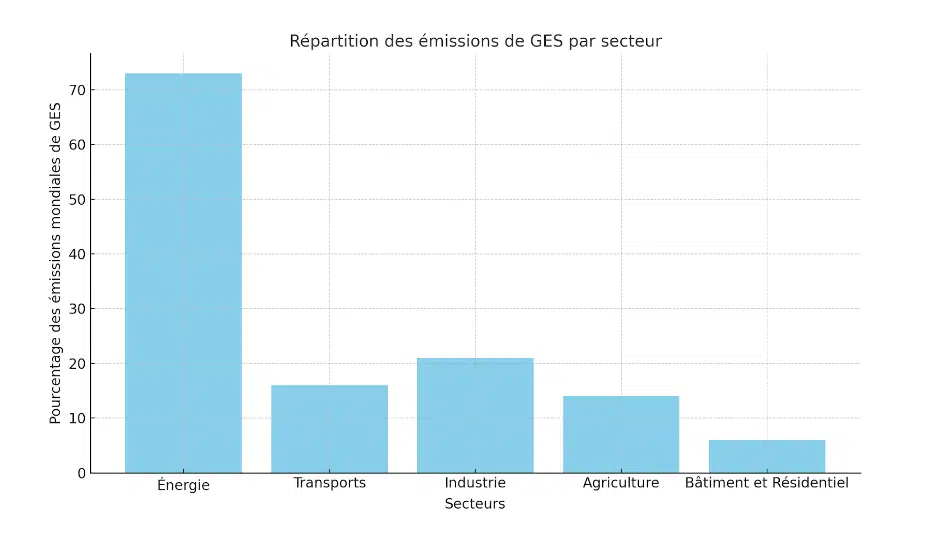
Carbon footprint comparison by sector
The energy sector is the largest contributor to greenhouse gas emissions, primarily due to the massive use of fossil fuels (coal, oil, gas). However, the transition to renewable energy (solar, wind) is underway in many countries to reduce these emissions.
The transportation sector, including road, air, and maritime transport, generates about 16% of global emissions. The rise of electric vehicles presents an opportunity to reduce the carbon footprint, although emissions from manufacturing and electricity production must be considered.
In the industrial sector, the production of steel, cement, and chemicals accounts for about 21% of global emissions. Solutions such as energy efficiency and carbon capture are being developed to reduce emissions in this sector.
Agriculture also contributes about 14% of global emissions, mainly due to methane produced by livestock and the intensive use of fertilizers.
Finally, the building and residential sector represents about 6% of emissions, stemming from energy consumption for heating, cooling, and inadequate building insulation.

Carbon footprint comparison by country
China is the largest emitter of greenhouse gases (GHGs), accounting for about 27% of global emissions. The united states follows with 11%, largely due to its reliance on fossil fuels. Despite reduction efforts, the european union contributes to about 6% of global emissions. India, with its fast-growing economy and population, generates around 7% of global emissions.
Per capita carbon footprints vary significantly between industrialized and developing countries. Wealthy countries like the united states and gulf nations have much higher per capita emissions, often due to high energy consumption and energy-intensive lifestyles. In contrast, developing countries such as india or some african nations have much lower footprints, as their populations consume fewer resources and rely less on fossil fuels.
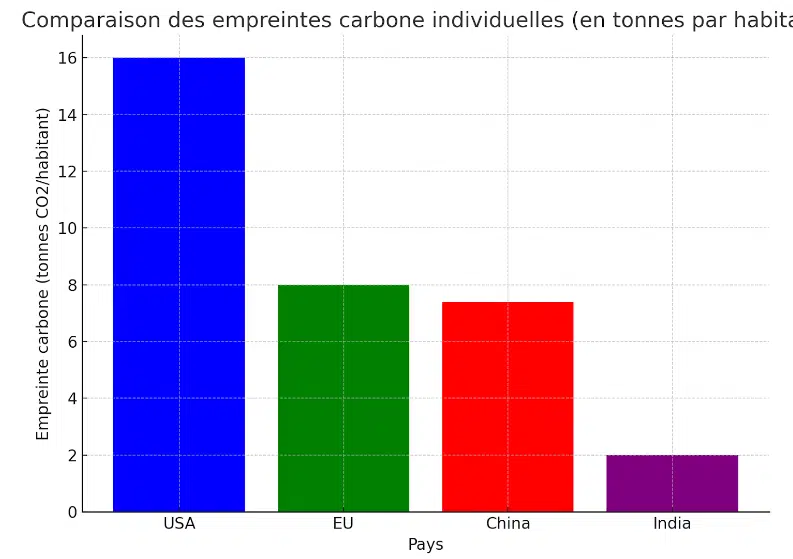
Comparison of individual carbon footprints
Individual carbon footprints vary greatly between countries. For example, in the united states, it is around 16 tons per year, while in india, it is about 2 tons. These differences are linked to consumption habits: in north america and europe, energy consumption, car travel, and meat-rich diets increase the carbon footprint. Conversely, developing countries have a lower footprint due to lower consumption of goods and services.
To reduce their carbon footprint, individuals are encouraged to adopt a plant-based diet, use sustainable transport (biking, public transport), and reduce domestic energy consumption.

Factors influencing carbon footprint differences
- Developed vs. emerging economies: developed countries, such as the united states or the european union, historically have higher carbon footprints due to early industrialization and high energy consumption. In contrast, emerging economies like india are experiencing rapidly increasing emissions as they develop.
- Dependence on fossil fuels: countries that rely primarily on fossil fuels (coal, oil, gas) to produce electricity and power their industries have higher carbon footprints. The transition to renewable energy plays a key role in reducing this footprint.
- Cultural and demographic factors: lifestyles, population density, and consumption habits vary from country to country, directly influencing the carbon footprint. For example, a lifestyle centered on heavy use of personal vehicles or high meat consumption leads to a higher carbon footprint.


