
Invest where each euro avoids the most.
Model each process, then rank your investments by the emissions each euro avoids, from the energy bill to the footprint of every product.
- AMUREBA-labelled energy auditors
- B Corp certified
- 4.8/5 on Capterra
Industrial companies that work with us
See all success stories








What we deliver
What industrial companies ask us.
- 10–30 %
- Off the energy bill, with the measures that follow an energy audit.
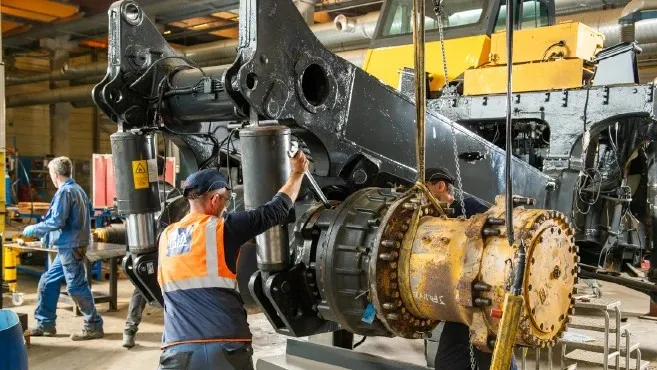
- Up to −92 %
- CO₂ when BIA renovates a 60-tonne haul truck instead of buying new.
Investments ranked by €/tCO₂e avoided
Your CAPEX (capital expenditure) ranked by what each tCO₂e (tonne of CO₂ equivalent) avoided costs or saves.
Decarbonization plan & SBTiProcess-level modelling
Each line, oven and compressor modelled: you see where the energy and the emissions go.
Carbon footprintEnergy
An energy audit on site, then the measures that take 10–30 % off the energy bill, ranked by payback, grants included.
Energy auditProduct footprint
PCF (product carbon footprint), LCA (life cycle assessment) and EPD (environmental product declaration), product by product.
Product footprintResults
They decided with us.
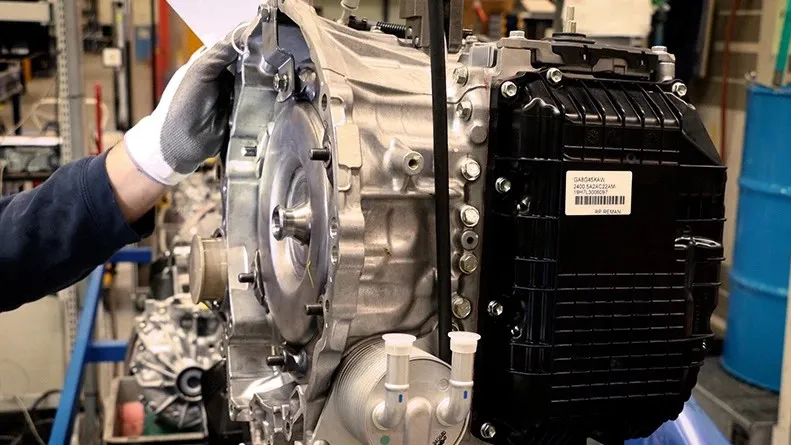
Aisin
Group footprintEntities worldwide · by country and by site
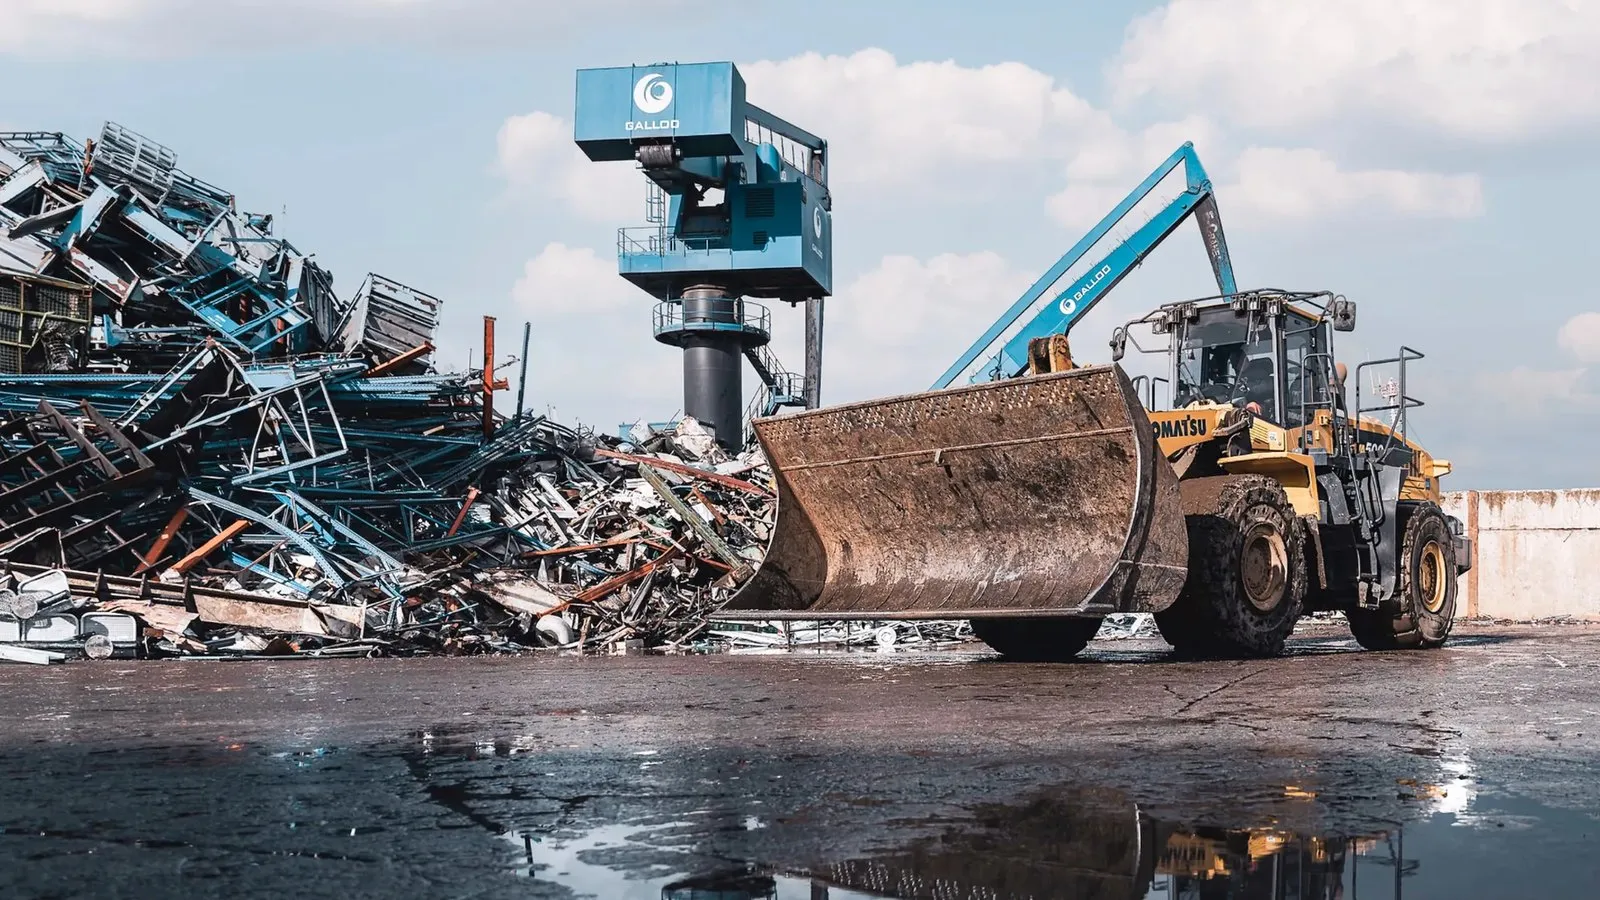
Galloo
43 entitiesGroup carbon footprint
Next step
Let’s rank your next investments.
A first 15-minute call to understand where you stand and what you need. No commitment.
- 300+companies
- 59countries
- 4.8/5 Capterra